Energy Monitor
Summary: EEMBC is now scoring MCUs for energy consumption. Here's a look at the tool they use.
Many are familiar with EEMBC's CoreMark (http://www.eembc.org/coremark/), a suite of programs used to compare processor horsepower. Traditional benchmarks don't do well in evaluating processors running embedded workloads.
They've recently added the ULPBench (http://www.eembc.org/ulpbench/), which is a program that exercises processors to determine how much energy they use. The benchmark consists of a number of mathematical and sorting operations. Then the processor goes to sleep. Over the duration of a number of these iterations energy use is monitored.
What do the scores mean? A non-charitable person might say "nothing." Each MCU has so many low-power modes it's awfully hard to make comparisons. Some might preserve RAM, others allow for quick response to interrupts, and all use different amount of energy. Further, the benchmark is likely not representative of your application. However, it does provide a somewhat objective way to compare MCUs.
EEMBC also sells a tool to take the energy measurements. Called the Energy Monitor, this $75 device is just a little PCB that connects (via USB) to a Windows application.
This device is one of the very few true energy monitors I'm aware of. Others generally call themselves "power monitors," which is a misnomer as they generally put a sense resistor in series with the power supply to measure current, not power. EEMBC's Energy Monitor is very different. The device under test is powered from a small capacitor that is charged as needed. A supervisory microprocessor controls the charging and monitors how much was required. The result: true energy usage expressed in microJoules. Where a current monitor might show one CPU uses 20 mA awake and another 1 mA, a measurement in Joules may show that the high-amperage part is awake for much less time than the other contestant, so in fact may use less energy from the battery.
They were kind enough to send me one, and I gave it a run on a Renesas RL78/G14 evaluation board. Installation of the Windows app was hindered by the unsigned USB drivers. The Windows 8 drill sergeant is sometimes really annoying. However, this site (http://www.howtogeek.com/167723/how-to-disable-driver-signature-verification-on-64-bit-windows-8.1-so-that-you-can-install-unsigned-drivers/) shows how to get around the problem.
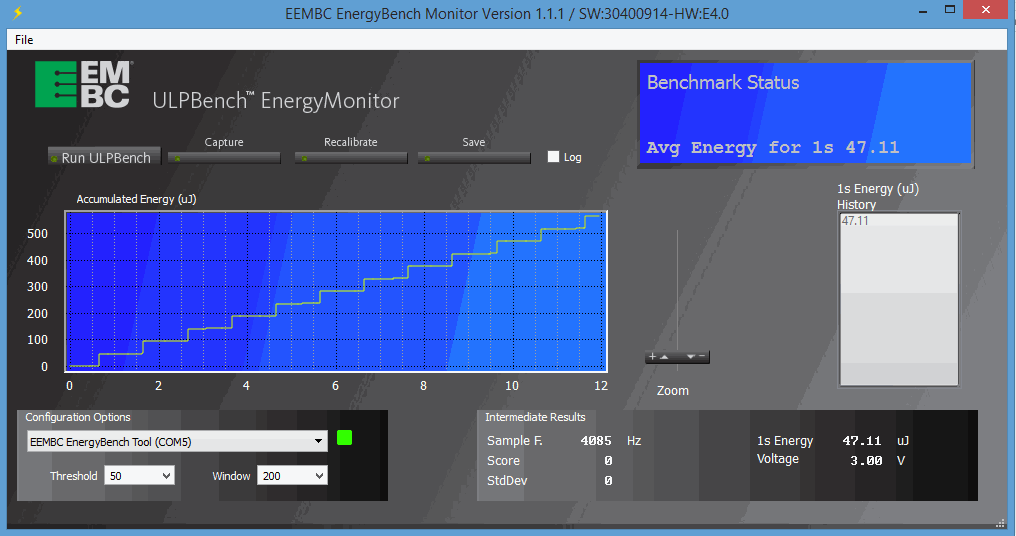
The benchmark code turns on an LED when the target is not asleep. My first run, with LED installed, yielded this:

The test repeated 12 times giving the staircase shape of the graph. Energy is being measured, and energy is power integrated over time. So each run adds to the test.
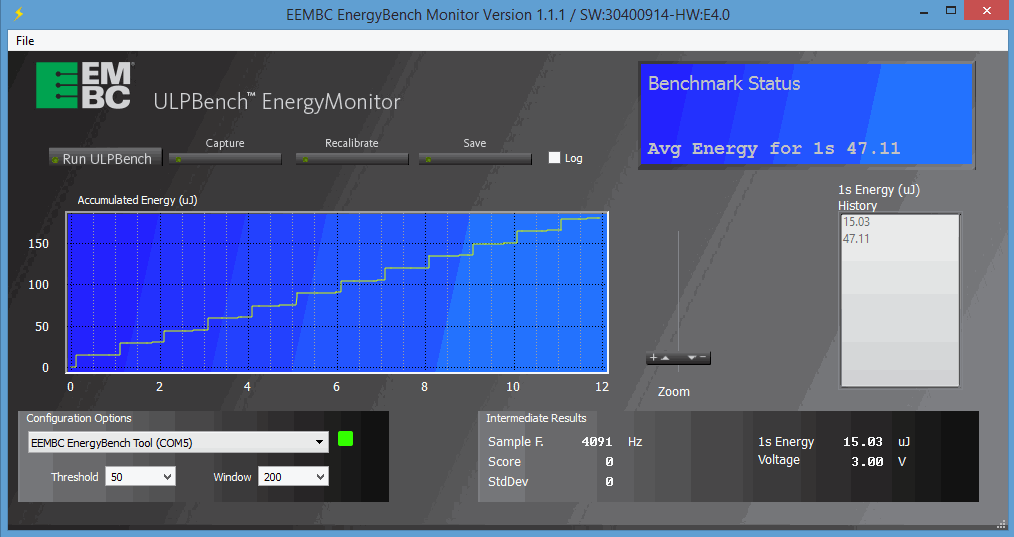
Removing the LED and the numbers are unsurprisingly smaller. Note that the graph nicely autoscales:

The claimed accuracy is 1% for currents under 1 mA, 2% over that to a max of 28 mA. On the low scale it will resolve to 50 nA, more than enough for monitoring the behavior of ultra-low power systems that must operate for years off a small battery.
Traditional benchmarks may not give useful performance metrics for any particular application, but at least they are repeatable. One wonders about energy measurements. I've complained in this space about so many vendors not giving worst-case current consumption numbers, and recently (http://www.embedded.com/electronics-blogs/break-points/4438724/Freescale-v--too-many-others) lauded Freescale for publishing detailed metrics. For their Kinetis parts they cite max as the mean of many parts plus 3 sigma. With neither the mean nor the standard deviation listed, though, testing a single MCU may not tell us much about max energy consumption. Full characterization may require testing many parts. And if your device runs over a wide temperature range, better figure on running those sorts of tests, too.
As I mentioned, the ULPBench code may or may not mirror your application's power profile. What's nice, though, is that this really inexpensive tool takes great data, and the benchmark code is available. Tune it to meet your needs and they you can evaluate MCUs from different vendors.
Published March 9, 2015

