Go here to sign up for The Embedded Muse.
The Embedded Muse Logo The Embedded Muse
Issue Number 457, November 7, 2022
Copyright 2022 The Ganssle Group

Editor: Jack Ganssle, jack@ganssle.com

   Jack Ganssle, Editor of The Embedded Muse

You may redistribute this newsletter for non-commercial purposes. For commercial use contact jack@ganssle.com. To subscribe or unsubscribe go here or drop Jack an email.

Contents
Editor's Notes

SEGGER Embedded Studio cross platform IDE

Tip for sending me email: My email filters are super aggressive and I no longer look at the spam mailbox. If you include the phrase "embedded muse" in the subject line your email will wend its weighty way to me.

Quotes and Thoughts

"You will say that I am always conjuring up awful difficulties & consequences - my answer to this is it is an important part of the duty of an engineer." Robert Stephenson, the engineer of the Britannia Bridge.

Tools and Tips

Please submit clever ideas or thoughts about tools, techniques and resources you love or hate. Here are the tool reviews submitted in the past.

Here's Niall Cooling's in-depth look at Arm Cortex-M Intel-Hex (ihex) files.

Volatile is a critical keyword for embedded developers. Here's a short but useful article about it.

Martin Glunz wrote about SSD's and speed improvements:

To my knowledge, it's not so widespread known that compiling with gcc works way faster using Linux and its ext4 filesystem than using the same compiler using Windows and NTFS. I've experienced speed differences of 5 ... 10 faster under Linux than Windows on the very same hardware (natively booting either Linux or Windows from the same SSD). In some forum I was told this is a major flaw of the NTFS filesystem, having a "global lock" for all accesses, slowing down anything that uses a lot of file I/O.

One can notice the difference too within WSL2 (the Microsoft attempt to draw linux developers to Windows), if one compiles on the ext4 filesystem of the virtual machine or the mounted NTFS.

Freebies and Discounts

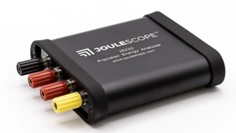
The folks at Joulescope kindly sent us a couple of their Joulescopes for this month's giveaway. The Joulescope is a great tool for monitoring energy use in IoT devices. A review is below.

Enter via this link.

Saving Tools for the Long Time

Readers had some more feedback about preserving toolchains. Will Cooke wrote:

In response to "Source Controlling Tools" I have one method I have used with personal work, thought not at any paying job.  I create a VM with all the correct software, including OS and settings, while the system is current.  I make sure that builds on the VM come out exactly the same as the native software.  Then I can archive the entire VM and have it available later when some part of the setup is no longer available.
Two flaws with this.  One, if any part of the setup has to access the "cloud" to run we are back where we started.  Fortunately, most tools don't have to, even if they do access it.  The second flaw is, what if we no longer can run the VM?  
But, it's a partial solution.

Robert Ferrante is one of meany using VMs:

Just a thought, but couldn't you install the suite of tools into a VM, then save the VM for future use? When you need to maintain that product, restore the VM and you're back in business. Another thought would be to use a cloud VM, back it up of course, but with some cloud vendors you can pay by the hour of CPU use and just leave it dormant most of the time, essentially costing nothing. Then you have the tool, libraries, exact system libraries and OS version, etc. Probably way behind on security patches, so you would want to consider how/whether you attach to the net.

Of course these are still subject to the VM vendor and cloud vendors maintaining compatibility for a long time, but, when they do make breaking changes they may have a VM-level upgrade process that allows you to stay current.

Ditto for Alex Barbur:

I've run into this issue before and one approach that might work is to install the tools in a virtual machine, export it (i.e. as an OVF image), and archive that instead. An additional benefit to this process is the virtual machine image can be used as a reference for developers when troubleshooting issues with their development environments; if you can import the VM and build the project inside of it then it's an issue with your local environment. The only downside is it typically requires a lot more disk space than just archiving the installer(s) and depending on which OS you use inside the VM you may have to learn a lot more about licensing than you'd otherwise want to (i.e. Windows).

Here's Helmut Tischer's suggestions:

What about installing OS+Tool into a well defined open format of virtual machine or container (e.g. OVF, qemu, bochs, docker, flatpak).
But still a "player" is needed which can interpret this.
There is some gossip about "nested virtual machines".
I don't know whether this what you expect from it’s name, and how mature this capability is now or when the last version of player which can handle your selected virtual machine or container format no longer runs on any OS which fits on your then current computer.

Martin Glunz wrote:

For my (personal) ARM Cortex projects I keep a bunch of compilers in /usr/local/gcc-arm-none-eabi-xxx and explicitely refer them from the Makefile that builds the projects. No fancy IDE involved at all. For a very particular old project I still have some old MS-DOS compiler wrapped into scripts calling DOSEMU and embedded into a gnu Makefile.

The project uses a weird combination of 32bit host gcc, embedded target gcc and said special compiler for a DSP - all integrated into a single "make all". This started on a side-by-side setup of a Win95 and a Linux computer back in the 2000's, and still works today on a modern 64bit Debian 11 machine.

Joulescope Review

Remember the massive electrical feeds that were needed to run old-time mainframe computers? Megawatts yielded a few MFLOPs. How astonishing it is that today we can run a computer from a coin cell for months or years!

So many embedded systems now run from the most minimal of power sources. But as I detail here https://www.ganssle.com/reports/ultra-low-power-design.html designing a low-power system involves far more tradeoffs and issues than most engineers realize. It’s hard to design low-power systems. That suggests that wise engineers will characterize their products by measuring actual current and energy needs.

But this is not easy! Asleep, the system might consume nanoamps. Awake, that zooms to milliamps or even amps. The dynamic range of the measurement is huge. You can’t simply put a sense resistor in the power line and measure voltage drop, as the resistance will need to be very high to sense sleep currents and very small to avoid voltage drops when the system is active.

Enter the Joulescope JS220, an instrument that can access a system’s power needs. Though it has a number of features, two that are critical for us are:

  • It can sense current over a huge range, some ten orders of magnitude. This lets it monitor everything from sleep states to high-power activities.
  • It switches current ranges very quickly, reputedly in about one microsecond. Thus, as your embedded system is wildly surging current demands the instrument can keep up.

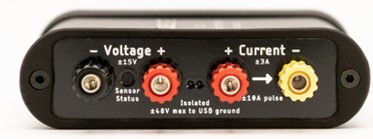
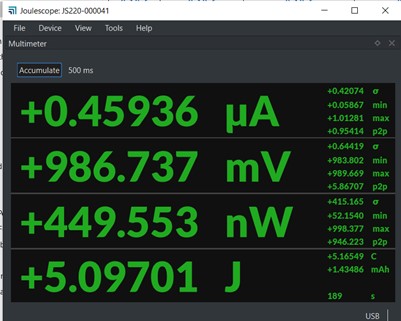
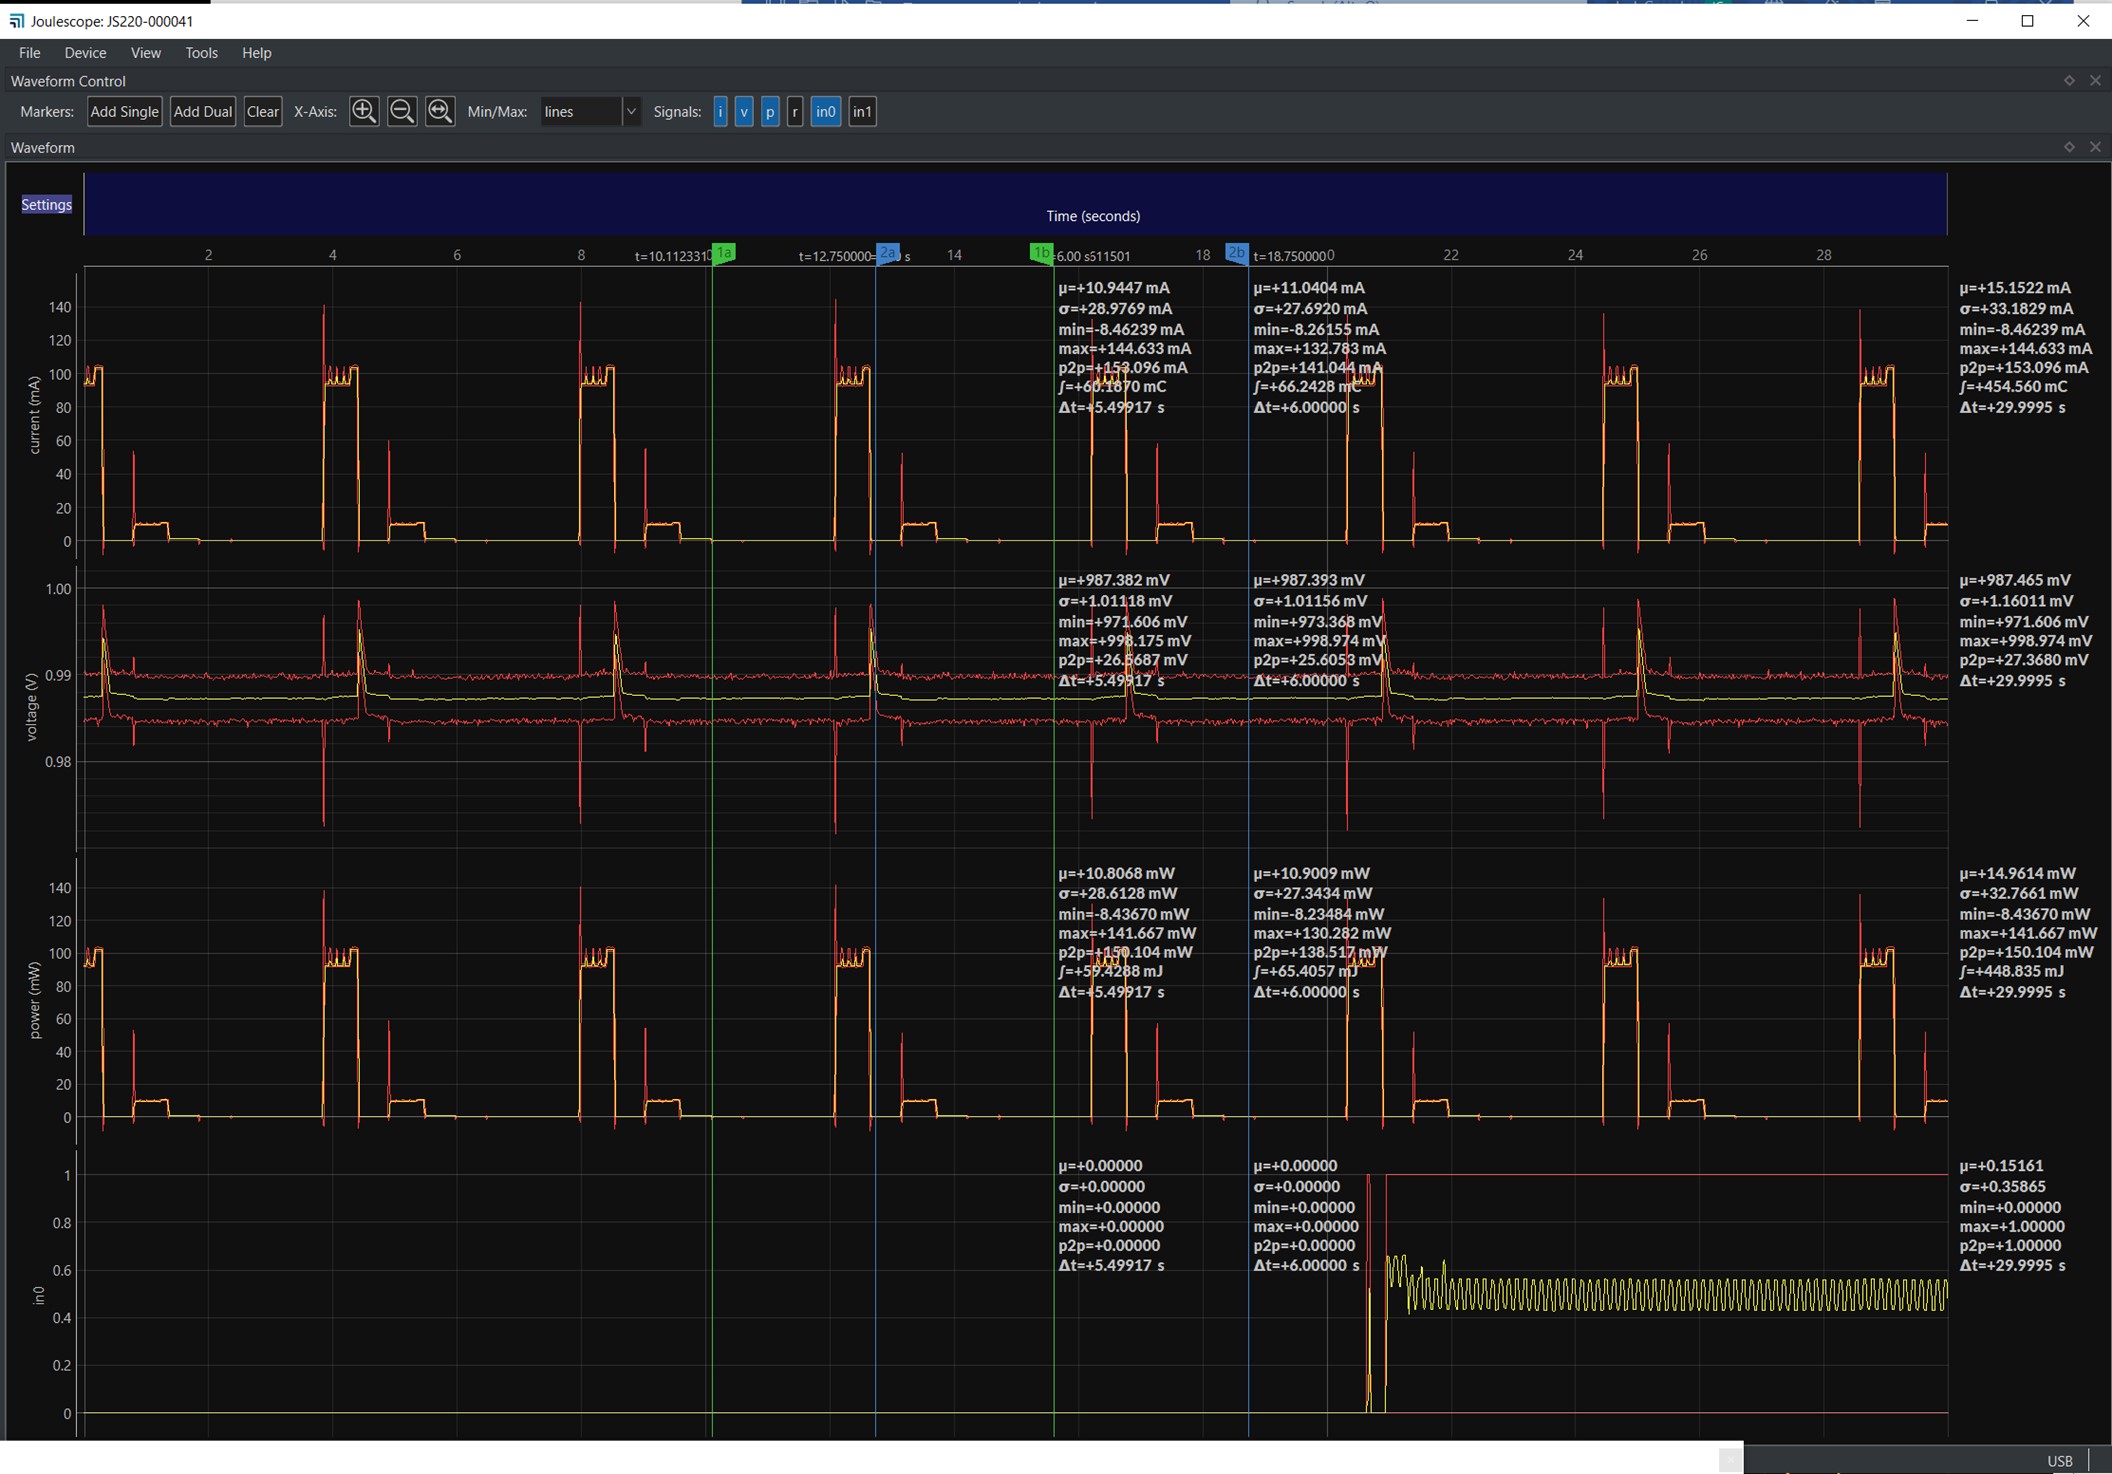
It’s a small nicely-engineered device that fits the palm of your hand, and is packaged in an elegant zippered case. It’s associated software runs under Windows, Linux and macOS. Unlike so many other tools, the user manual is very complete and well-written.

The primary specs are: 300 KHz bandwidth on V and I measurements with a 16-bit ADC (15.1 ENOB). Max of +/- 15V and 3A continuous, 10A pulsed (the duty cycle, though, isn't specified). Resolution (typical) is an astonishing 0.5 nA.

This is the business end of the unit. It provides terminals to monitor current and voltage:

The unit also has 4 GPIOs and a trigger, all of which can be configured as inputs or outputs. These signals let you correlate device-under-test activity with the Joulescope’s display.

I could write many words describing the instrument’s operation, but a couple of pictures will serve much better. Here is the unit’s “multimeter” display:

As shown, the Joulescope displays current, voltage, power and energy. Too many instruments that purport to measure a DUT’s “power” actually show current. Power is volts times amps, and it’s sloppy to conflate the two. Energy is the integral of power over time. It’s nice to show power, but is perhaps not terribly important given V and I, but energy is something we can’t derive from a conventional DMM’s results. This is an important parameter.

Also important are the standard deviations and min/max readings shown to the right. “p2p” is peak-to-peak, and, while nice to see, is pretty obvious from the min/max.  

The Joulescope also has an “oscilloscope” display:

(Click on image for a bigger display)

There’s a lot of info on this screen! V and I, of course, plotted over time. Statistics are displayed off to the right, including the energy (represented by the integral sign). While the multimeter display shows energy in Joules, the oscilloscope view presents energy in Coulombs. You may recall that 1 Joule is 1 Coulomb-Volt.

On the bottom there’s a GPIO configured as an input. What to know your system’s current profile as it powers up an external device? The GPIO display can sync the instrument’s display to that action.

Also shown are cursors with associated statistics.

I can’t think of a feature to add. The Joulescope is the best tool I've tried for measuring power and energy use in an embedded system. At $999 the price is right.

Engineering is all about predicting how your system will perform, building that system, and then measuring its behavior to insure it meets your predictions. Leave out the last step and it’s no longer engineering, it’s art. In my opinion, building a battery-operated embedded system without profiling its energy needs is professional malpractice.

Sine and Cosine

Jean-Christophe Mathae sent an efficient algorithm for generating a sine wave series - that is, to create a sine wave, rather than calculating sin(x).

   - 'A' is the amplitude of the generated sine wave
   - 'N' is the number of values in a period... So between each successive sine value there is an angle of 360°/N.

It is an very simple IIR "inverted Goertzel" filter that will happily generate a nice sine wave of 'A' amplitude and 'N' points per period with minimal computation:

d_theta = 2*π / N
c  = 2 * cos (d_theta)
y(0) = A * sin (0) 
y(1) = A * sin (d_theta)
...
y(n)  = c * y (n-1) - y (n-2)

Of course as 'n' increases computation errors will accumulate, so if needed we will have to "regenerate" the 'y (n-1)' and 'y (n-2)' values from time to time.

As I understand it, this filter is a perfect infinitely-narrow band-pass filter excited by a pulse. But I am by no way a mathematician ;-)

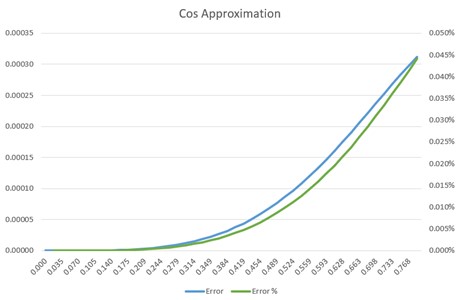
To carry the the approximation theme in Muse 456 a little further, here's one for cosine. Now, the deal with approximations is you can attain any accuracy you'd like given a small enough range of input values and a long-enough polynomial approximator. However, if you're after a fast algorithm you necessarily have to give up input range. Happily, sine and cosine are symmetrical so it's easy to do range reduction to fit an approximation that is good over a small range to the entire 0 to 2π (0 to 360°) circle.

Range reduction uses these relations:

sin(α) =  cos(α -90) = -sin(α-180) = -cos(α-270)
cos(α) = -sin(α-90)  = -cos(α-180) =  sin(α-270)
    

Here's a nifty cosine routine for the range 0 to π/4 (0 to 45°). The input is in radians:

cos(α) = 1 + α*α * (-0.5 + 0.04 * α*α)

Obviously, alpha squared can be computed once and reused. You can scale the coefficients and make this a very fast integer cosine. It's pretty accurate, too:


On Sending Data to the Cloud

Johan Kraft had some feedback about posting debug data to the cloud:

May I comment on Steve King's point about sending debug data to the cloud, in the last issue? This got longer than planned, but I think it could be of general interest. I tried to stay at the general principles and not promote DevAlert too much. If needed, I can propose a shorter version.

Uploading debug data to the cloud can indeed be sensitive and opt-in is required if you don't already have permission to use the data from the device. However, many devices today are provided specifically for use with an associated cloud service, meaning there already is an application data stream to the cloud. This typically includes some form of customer data, such as sensor readings, and this is structured data intended for automatic processing. In contrast, the debug data only provides snapshots of the software behavior, where any application data that happens to be included isn't explicit or easily available for automated processing. So in this context, debug data is not necessarily more sensitive than the already provided application data. But of course, developers still need to be careful to not include sensitive customer data in debug data uploads. We have therefore designed DevAlert to be 100% transparent for the OEM and allow for detailed control over the included data.

Implementing remote debug monitoring in a secure manner isn't a walk in the park. It takes some consideration. But the alternative is basically to stick your head in the sand and remain unaware of the remaining software defects until customer complaints are piling up and the damage is already done. Moreover, each latent defect is not only a potential disruption for the end user, but also a potential vulnerability. With remote debug monitoring, such defects can be detected and fixed quickly after the very first accidental occurrence, before being exploited or causing widespread disruptions.
 
In my view, this is a choice between the hypothetical risks of using a specific monitoring framework compared to the very real risk of unknown defects and vulnerabilities remaining somewhere in a large code base, often 100’s of KLOCs with many 3rd party libraries. The next question is probably about the security of the proposed monitoring solution. Let me share the security principles we have used when designing DevAlert. I'm of course biased, but believe these are good principles for any monitoring solution of this type.

1. No direct communication between the devices and the DevAlert cloud service, but instead piggyback on the existing cloud connection already used for the application data. The integration with the DevAlert service happens in the cloud, using secure HTTPS calls with two-way certificates.
 
2. Don’t risk creating new attack surfaces in the device. The DevAlert device library doesn't introduce any new communication code or listens for inbound connections. One-way communication only and only transmits data when requested.
3. Minimize data needs in the cloud service. The DevAlert cloud service only ingests user-defined "fingerprints" of the issues, needed for aggregation and notifications. The ELF file and debug data stays in the OEM's private storage at all times.
4. Debug data is only analyzed locally on the developer's computer, using e.g. Tracealyzer and GDB.
This way, the debug data is handled in the same way as regular application data and with the same level of security. This obviously assumes a secure cloud connection, such as MQTT over TLS, but this is today provided by most IoT cloud vendors.

You had an interesting point that the remote IP address could reveal the device vendor to an attacker sniffing the Wifi. That would certainly be true if the device is contacting a company server directly, e.g. like “product.xyzcorp.com”. However, that is not the case when using a 3rd party IoT cloud provider, like AWS or Azure. The remote IP address then only reveals an anonymous endpoint at the IoT cloud provider, like "asdfghjk123456.iotcloudprovider.com". While it might be known to the attacker that a certain product is using this particular endpoint, this is not revealed by the Wifi connection alone. The risk that the remote endpoint might reveal the device type is a general risk with any connected device, even though security shouldn't rely on obscurity. However, when using our approach, that risk is not increased since the debug uploads are added to an existing connection. Moreover, remote debug monitoring could help the vendor detect and patch such vulnerabilities before being exploited.

If you have any follow-up questions or comments, feel free to reply or contact us directly using the contact form on our website, https://percepio.com.

Failure of the Week

From John Sloan:


From Emerson Beserra:

Have you submitted a Failure of the Week? I'm getting a ton of these and yours was added to the queue.

Jobs!

Let me know if you’re hiring embedded engineers. No recruiters please, and I reserve the right to edit ads to fit the format and intent of this newsletter. Please keep it to 100 words. There is no charge for a job ad.

Joke For The Week

These jokes are archived here.

From Steve Bresson:


About The Embedded Muse

The Embedded Muse is Jack Ganssle's newsletter. Send complaints, comments, and contributions to me at jack@ganssle.com.

The Embedded Muse is supported by The Ganssle Group, whose mission is to help embedded folks get better products to market faster.