|
||||
You may redistribute this newsletter for non-commercial purposes. For commercial use contact jack@ganssle.com. To subscribe or unsubscribe go here or drop Jack an email. |
||||
| Contents | ||||
| Editor's Notes | ||||
Over 400 companies and more than 7000 engineers have benefited from my Better Firmware Faster seminar held on-site, at their companies. Want to crank up your productivity and decrease shipped bugs? Spend a day with me learning how to debug your development processes. Attendees have blogged about the seminar, for example, here and here. I'll present the Better Firmware Faster seminar in Melbourne, Australia February 20. All are invited. More info here. Please note that the seminar is nearly full. As I noted in a recent blog, I'm cutting back significantly on travel, so this will be my last trip to Australia. It's a beautiful country with great people, but a long way from my homestead in Maryland. |
||||
| Quotes and Thoughts | ||||
Software specifications and documentation are often an afterthought, and the development of requirements after the design is created is sometimes even touted as a benefit or necessity. This simply isn't true for safety-critical software where the loss might involve not only human life but physical property, critical mission loss, and damage to the environment. It should be considered malpractice for software to be created before the safety requirements are identified. - Nancy Leveson |
||||
| Tools and Tips | ||||
Please submit clever ideas or thoughts about tools, techniques and resources you love or hate. Here are the tool reviews submitted in the past. |
||||
| The Futility of Testing | ||||
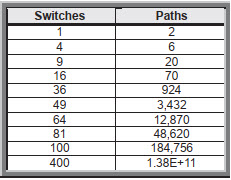
The next article is a review of a debugger that includes code coverage, which insures every statement and even every instruction in a program gets tested. However test is simply not adequate to ensure an application is correct. Test does nothing to evaluate the correctness and completeness of the requirements, for example. But absent coverage, it's impossible to know if all of the code has been evaluated. A big project may have so many possible paths that insuring 100% coverage could be a huge effort. In The Software Quality Challenge by the brilliant and sadly-deceased Watts Humphrey, published in the also sadly-deceased CrossTalk magazine (June 2008), Humphrey shows that the number of paths (and therefore required tests) a program can take depends on the quantity of decisions contained. Here's his results:
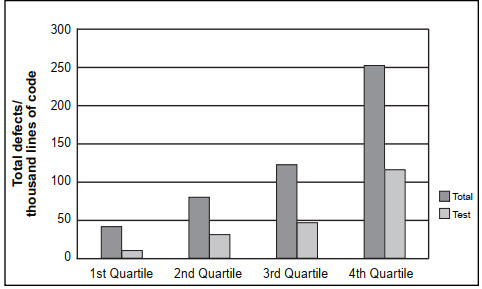
His analysis is based on an extreme assumption that every branch is likely to affect every other. However, the numbers are stunning and thought-provoking. One takeaway is that it's incredibly important to decouple modules as much as possible so Humprey's assumption (every branch is likely to affect every other) doesn't haunt our efforts. He goes on to graph pre-test error rates for 810 experienced developers:
(Note that test finds only about half of all defects, a result consistent with many other studies). |
||||
| A Review of SEGGER's J-Trace and Ozone | ||||
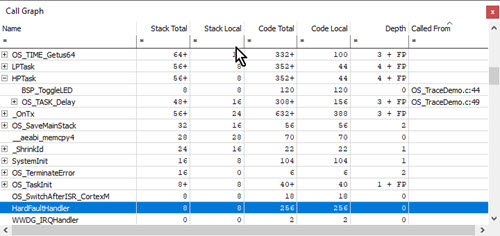
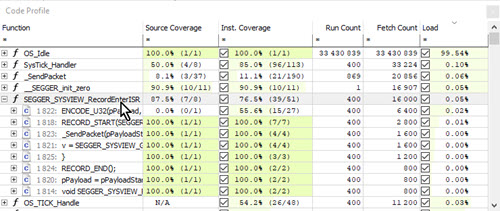
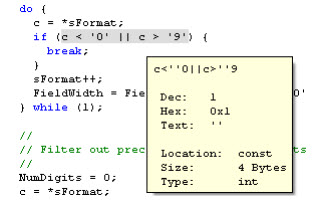
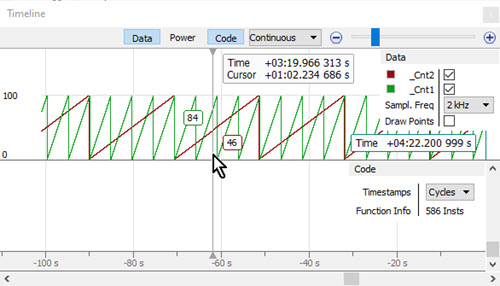
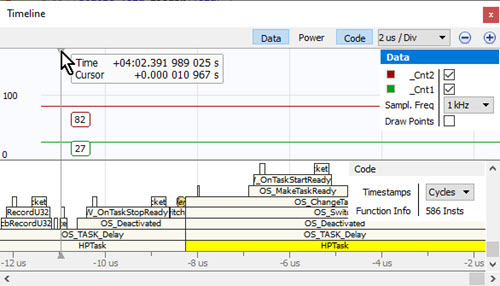
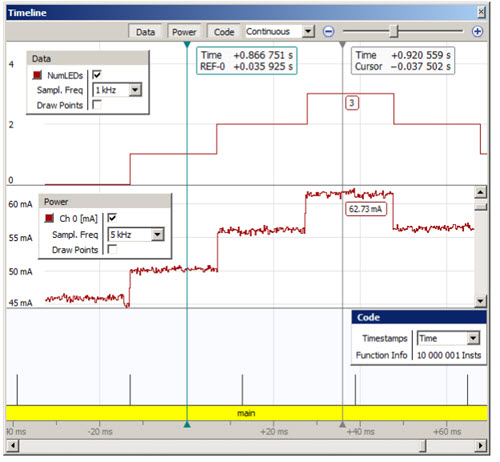
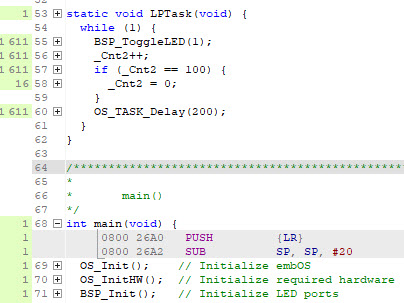
I generally don't do traditional reviews of software, as most software tools have a vast number of features. However, I do make general observations about these tools, which is what follows for SEGGER's J-Trace Pro and their "Ozone" debugger. First, full disclosure: SEGGER places paid ads in the Muse and on my web site. The J-Trace Pro I evaluated is for Cortex-M/A/R, processors. The motivation for these observations started at last summer's Embedded Systems Show in California. I was walking past SEGGER's booth and saw a demo of their coverage feature (which shows the lines of code that were executed). While I think measuring coverage is important, it's also problematic as most tools instrument the code. For line-by-line coverage that can add a lot of overhead, undesirable in a real-time system. I inquired and was told SEGGER's version adds no overhead. It's measured by watching the real-time trace data supplied by the Arm processor. That's a bit of a game changer. Part of the problem with usual test regimens is that they are usually incomplete; one just doesn't know if the entire program was exercised. With coverage that ambiguity goes away. While coverage alone doesn't prove the code is correct, it does show that everything was at least executed. That is mandated by the most demanding standards, like the highest category of avionics testing. (The recent 737-MAX woes also demonstrate that test alone is inadequate). SEGGER's J-Trace is a hardware debugging probe. While it works with IDEs from many other vendors, for my testing I used SEGGER's Ozone debugger program. The package costs $2498 and is currently available. A Cortex-M only (no -A or -R processors) is $1748. Installation of Ozone and starting the demo on the supplied Cortex-M4 demo board took only a few minutes and was brain-dead easy. The demo program is a simple two-task LED blinker using the company's embOS RTOS. Ozone appears to have SEGGER's SystemView monitor (I reviewed it in TEM299) program integrated. There are so many useful windows in Ozone that you'll want a big monitor. Mine is 24" and I wouldn't want anything less. The application appears deceptively simple when first opened. File, View, Find, Debug, Tools, Window and Help are the only pull-down menu items; with the exception of the View menu, each of those pull-downs has only a few entries. It's mostly controlled via a vast number of right-click context-sensitive items. Ozone is very flexible in letting you add buttons to the toolbar, and I suspect that after a few minutes using it you'll add your favorite actions to reduce two clicks to one. Here are my observations:
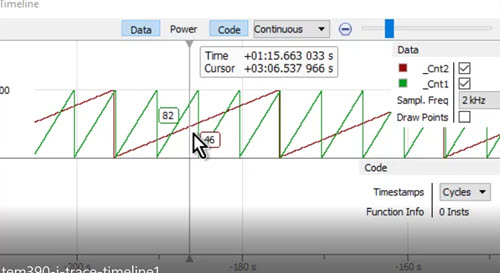
There's much more in the Ozone/J-Trace tool. The above comes from reading the first 135 pages of the 312 page manual; I simply ran out of time. The manual is pretty complete but I felt it's hard to use; it needs more examples of using the features. And there are a lot of forward references which can make understanding a feature a bit difficult. The manual is arranged in alphabetical order of the windows which means some complex ideas are introduced before the basics. Ozone is extremely responsive, and I encountered no notable delays. Click on this short video to see how quickly things are updated as I slew the cursor around:
The application is pretty intuitive, though there are so many features you'll want to curl up with the manual. Did I say feature-rich? I can't think of anything extra we'd want in a debugger other than the mythical "find bug" and "fix bug" buttons. A very important feature is that acquired data can be exported to a file. That's crucial in many safety-critical projects where regulatory agencies require proof about testing completeness. And it's valuable to QA departments as well. Examples of exportable data include code coverage, count of statements executed, register, variable and even expression results. In the 1980s and 90s I ran a company that made In-Circuit Emulators. These were debugging tools that offered tons of features that all ran in real-time. The ICE business imploded early this century for a number of reasons, but the death knell was that they just couldn't keep up with emerging fast clock rates. The embedded community then regressed to simpler debugging probes which were inexpensive, but feature-poor. Ironically, our applications were growing in complexity yet our tools fell behind. The J-Trace has gone beyond what ICEs could do. I'm very impressed. You can find an overview of the J-Trace Pro and a tutorial about using it here. |
||||
| Final Thoughts on New Year's Resolutions | ||||
Wouter van Ooijen has thoughts about C++"
Finally, Capers Jones published Twenty Five Software Engineering Targets from 2015 Through 2019 five years ago. These aspirational goals might make a basis for New Year's resolutions. I disagree with some of these, and many, while as desirable as a resolution to achieve world peace, are about as hard to attain. (Jones uses function points, each of which is about 130 lines of C.) His yearning to reach measurable goals is praiseworthy:
|
||||
| This Week's Cool Product | ||||
Not quite yet a product, but for ultra-low-power products, why not use the triboelectric current from falling snow? Note: This section is about something I personally find cool, interesting or important and want to pass along to readers. It is not influenced by vendors. |
||||
| Jobs! | ||||
Let me know if you’re hiring embedded engineers. No recruiters please, and I reserve the right to edit ads to fit the format and intent of this newsletter. Please keep it to 100 words. There is no charge for a job ad. |
||||
| Joke For The Week | ||||
These jokes are archived here. At the source of every error which is blamed on the computer you will find at least two human errors, including the error of blaming it on the computer. |
||||
| About The Embedded Muse | ||||
The Embedded Muse is Jack Ganssle's newsletter. Send complaints, comments, and contributions to me at jack@ganssle.com. The Embedded Muse is supported by The Ganssle Group, whose mission is to help embedded folks get better products to market faster. |