|
|
||||
You may redistribute this newsletter for noncommercial purposes. For commercial use contact jack@ganssle.com. |
||||
| Contents | ||||
| Editor's Notes | ||||
Are you a member of the 1%? I don't mean the economically elite; rather, the software engineering elite. Those who inject just about 11 bugs, in requirements gathering through coding, per thousand lines of code. The 99% do much worse, averaging about 120 bugs per KLOC. Wouldn't you want to be in the top tier of developers? That is part of what my one-day Better Firmware Faster seminar is all about: giving your team the tools they need to operate at a measurably world-class level, producing code with far fewer bugs in less time. It's fast-paced, fun, and uniquely covers the issues faced by embedded developers. Information here shows how your team can benefit by having this seminar presented at your facility. Follow @jack_ganssle
I'm now on Twitter. |
||||
| Quotes and Thoughts | ||||
"I don't care if it works on your machine! We are not shipping your machine!" - Vidiu Platon |
||||
| Tools and Tips | ||||
Please submit clever ideas or thoughts about tools, techniques and resources you love or hate. Here are the tool reviews submitted in the past.
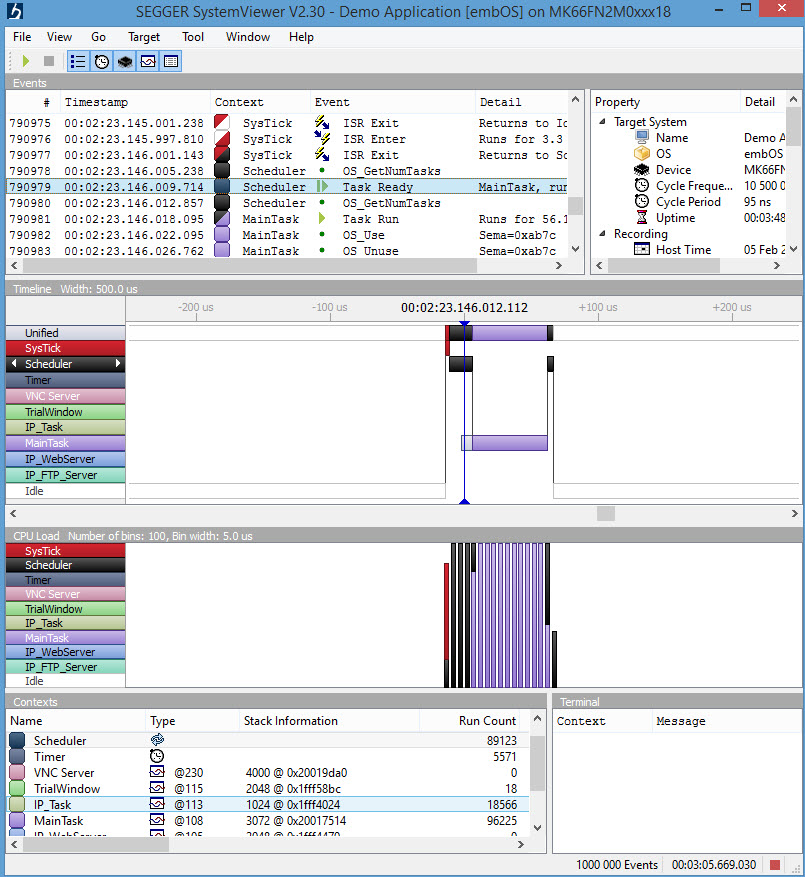
It's hard for a developer to know what's going on inside of an embedded system that may not have much in terms of a display. Traditionally we use debuggers, but those only give us a static view of what's going on. Trace capability captures real-time operations, but overwhelms with a fire hose of instruction-by-instruction information. In contrast, SystemView logs events -- task switches, API calls, etc. Competing tools exist: Express Logic's TraceX, Percepio's Tracealyzer and Micrium's uC/Trace are examples. Segger's SystemView is a free, stand-along application not bound to any RTOS. It comes with hooks for their own embOS RTOS and FreeRTOS, but the manual describes how to use it with any other operating system -- and in systems that don't use one. Versions are available for Windows, OS X and Linux. A picture is worth a thousand words, so here's SystemView's screen:
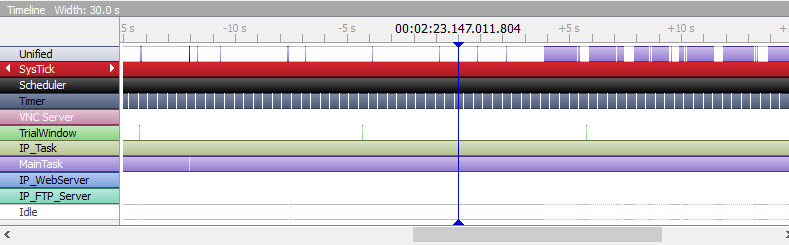
The middle ("timeline") window shows the system transitioning between tasks and states. The middle vertical blue bar is the cursor (just under the "4" in "00:02:23.146.012.112", which is over a black region that corresponds to the scheduler (task/context names and colors are on the left). It's also over the light gray bar associated with the main task. Looking at the top ("events") window we see that is marked "Task Ready MainTask." In other words, the MainTask goes ready at this time, though it isn't running. To the left of the cursor the red bar is the SysTick, which quickly invokes the scheduler. Soon the scheduler drops down to the blue MainTask that starts doing its thing. We're watching the RTOS multitask. The timeline's indicated time is in hours, minutes, seconds, ms, us and ns -- quite a bit of resolution indeed, though in practice that's limited by the MCU's clock rate. The APIs in the embedded system (RTOS and/or any bit of middleware) are instrumented to transmit data to the host computer when an event occurs. Those are all shown in the top "events" window, though you can selectively disable certain kinds of events from the display. So in essence the events window is the raw logged data and the timeline a translation of that into a graphical view of what happens when. You can drag the timeline left and right to see other events, and zoom in and out. Here's a very zoomed out snapshot of the same program (this image is a capture of just the timeline):
Here the SysTick, which interrupts every millisecond, has occurred thousands of times and so looks like a solid red bar. Other tasks, like IP_Task, have been invoked as well. The window named "CPULoad" shows where the time is going. Some of the histogram's bars are solid blue -- that's where the blue MainTask was eating all of the CPU's time. These are organized as bins; you can select how wide each bin is. The bin at the cursor is black since the scheduler, which was assigned the color black, is running. The bar to the right of that is partially black and blue, since in that bin some execution time was spent in the scheduler and some in MainTask. The lower right window marked "terminal" displays printf-like data sent from the target code. Like all of these products SystemView relies on instrumented target code. The company's documentation claims the overhead is about 2kB of flash and under 1kB of RAM (though the acquisition buffer can be longer). And they also claim that on a 200 MHz Cortex real-time overhead is under one percent. The user's manual shows clearly how to instrument non-Segger (and non-FreeRTOS) operating systems and other middleware. It says the work should not take more than a few minutes; maybe I'm a slow learner, but this is a powerful and complex tool with a rich API. I'd figure on a couple of hours by the time you've read and understood the manual and have gotten things running. The product runs in one of two modes. If you're using one of their J-Link debugging probes (298€ and up), and the target is a Cortex-M or Renesas RX, it will collect data in real time forever. It's possible to lose data in the comm link if a ton of debugging information is being exchanged at the same time as SystemView is running, but that's easy to avoid. You can gate acquisitions via the SEGGER_SYSVIEW_Start() and SEGGER_SYSVIEW_Stop() calls to capture only narrow events of interest. The user's manual is here and is the best resource if you want more information.. I'm impressed. The tool is easy to use and very, very fast. The tabular and graphical views of the sequence of events is a huge time-saver when building multitasking systems. The tool's one shortcoming is a lack of a search for finding particular events in captured data. That's on Segger's to-do list. And I do wonder what the screen would look like if there were many dozens of tasks. A vertical scroll bar doesn't appear in the timeline window; each task gets smaller vertically to the point where it's hard to read names. They tell me a scroll bar is in the works, which is great, but it may be a nuisance to have to scroll vertically to see the task interaction. Highly recommended. And you can't beat the price (free). |
||||
| Freebies and Discounts | ||||
Mike Lillywhite is the lucky winner of last month's contest; he got a copy of Hardware/Firmware Interface Design.
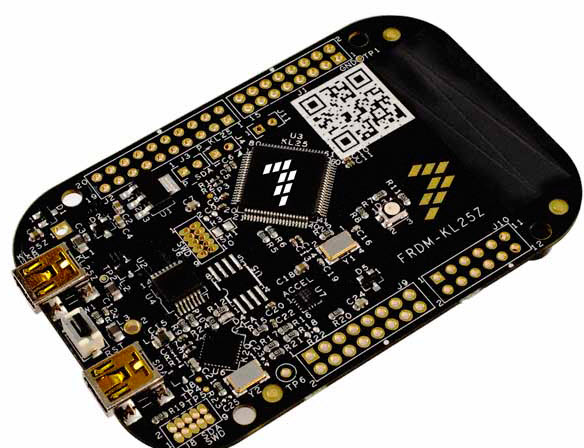
Reader feedback about these giveaways has been very positive. So this month I'm giving away a FRDM-KL25Z development board, which was kindly provided by Freescale. This board has a Cortex M0+ MCU. One neat feature is that it works with the mbed tool chain, which is a web-hosted C compiler. There's nothing to install. For small projects and experiments it's a really fast way to get started. The contest will close at the end of February, 2016. It's just a matter of filling out your email address. As always, that will be used only for the giveaway, and nothing else. Enter via this link. |
||||
| How Many Defects Can Your System Tolerate? | ||||
How good do you have to be at finding and removing software defects before shipping a product? A related question is, if you find X% of the bugs prior to shipping, what are the odds a system will fail in a given period of time? It's not easy to calculate this for a real-world project, but there is a lot of empirical data from which we can draw some conclusions. Well, maybe nothing as sound as a conclusion, but just as an impressionistic painting gives a fuzzy view of a subject, we can play with the numbers and get a sense of an answer. So the following is no attempt to be scientific; rather it's a thought experiment. First, some definitions:
We'd like to know what the probability that the system will fail in some period of time - say, the first year. This is the number of critical defects injected into the code and not removed prior to shipping, times the probability one of those will actually occur. So, the probability that the system will fail in a the first year is: P = Di * Dc * S * (1-DRE/100) * Pm where,
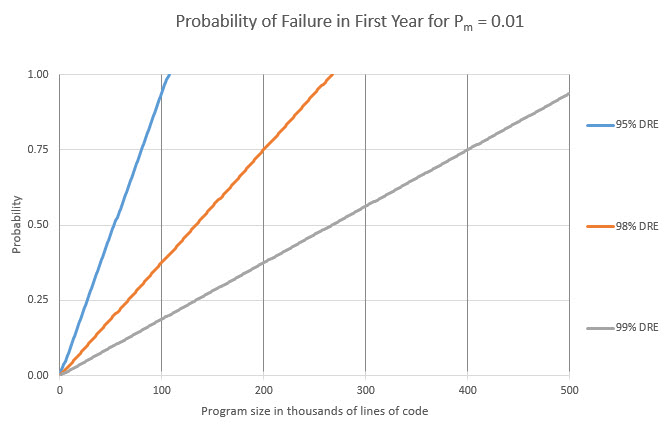
I don't know what Pm is, and of course it will vary depending on the development team, nature of the product, and maybe even the alignment of the planets. Let's try Pm = 0.01. That is, the odds of a critical defect happening in the first year is one in 100. That seems very low to me but for the sake of this gedankenexperiment we'll see what happens. Here are the results for three different DREs (95%, 98% and 99%) and programs ranging in size from 1 KLOC to 500 KLOC:
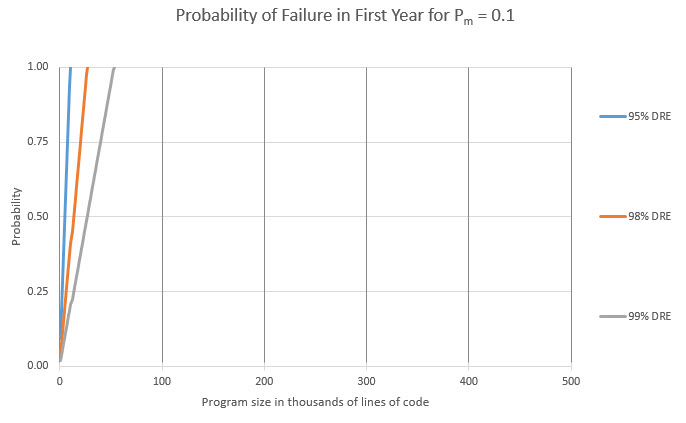
Scary, huh? This chart shows that, absent extremely-good DREs, failure is inevitable as programs grow in size. The industry-average of 95% will doom bigger projects. I think Pm=0.01 is much too low. Let's try 0.1 (Dc, the fraction of defects that are critical, is still 0.25). In other words, there's a one in ten chance a critical defect will bite in the first year:
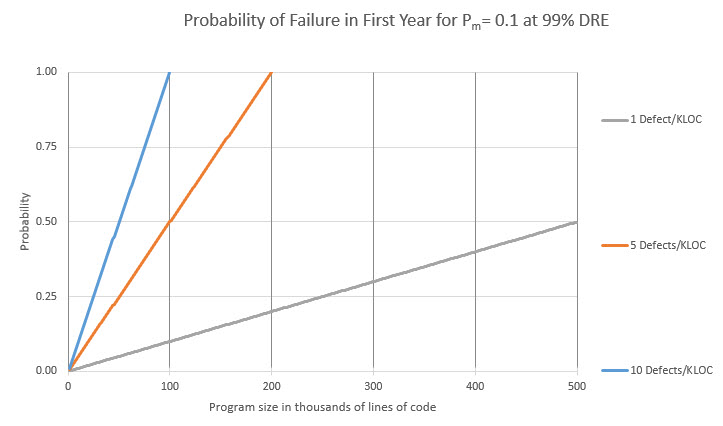
In these graphs I used empirical defect and critical defect rates to explore the effect of different DREs. Now, suppose we could achieve a 99% DRE - what is the probability of failure (in the first year) given different rates of injected defects (Di)? These include both critical and non-critical defects:
Average firmware teams inject about 75 defects/KLOC, and ship about 4. This graph shows that once a program gets big there is almost no tolerance for defects. Large programs must be more perfect, prior to debug and test, than average code is after the latter is tested and deemed ready to ship. There are a lot of caveats. A system can be designed to recover, perhaps via a watchdog, from a failure. Some systems recover so well the user never realizes a problem surfaced. A TV remote control could be designed so any button push restarts the MCU - it might crash, but the operator instinctively presses the button again and never realizes there was a problem. Those who have attended my seminars know I'm huge - or, as a current presidential aspirant would say, yuge! - on metrics. In software engineering the numbers are always shrouded in error bands, but they do paint pictures that give us important insights. Thanks to Scott Rosenthal for a heavy critique of the draft of this article and for cleaning up the graphs. |
||||
| More on Using VMs to Maintain Old Systems | ||||
In the last Muse a couple of readers suggested using virtual machines for long-term product support, rather than saving an old, for example, Windows XP box that has your tools loaded. Andrzej Telszewski had some more thoughts on this:
|
||||
| Jobs! | ||||
Let me know if you’re hiring embedded engineers. No recruiters please, and I reserve the right to edit ads to fit the format and intents of this newsletter. Please keep it to 100 words. There is no charge for a job ad. |
||||
| Joke For The Week | ||||
Note: These jokes are archived at www.ganssle.com/jokes.htm. From Dale Force: We are developing a game based on Ayn Rand’s "Atlas Shrugged". We are looking for objectivist-oriented programmers. |
||||
| Advertise With Us | ||||
Advertise in The Embedded Muse! Over 25,000 embedded developers get this twice-monthly publication. . |
||||
| About The Embedded Muse | ||||
The Embedded Muse is Jack Ganssle's newsletter. Send complaints, comments, and contributions to me at jack@ganssle.com. The Embedded Muse is supported by The Ganssle Group, whose mission is to help embedded folks get better products to market faster. |