

2004 Salary Survey
Of Embedded Systems Engineers
The latest data for 2018 is here.
Every year Software Development Magazine runs a salary survey for programmers. Unfortunately that genre includes embedded developers, IT programmers, PC developers and even web designers. No one studies the embedded systems population, which is quite distinct from other dialects of developers.
On December 6, 2004 I sent a request to participate in an embedded survey to the approximately 15,000 readers of The Embedded Muse. 1214 went to the web page and submitted data.
This is hardly a scientific survey; no tests were performed to ensure the accuracy of the data. It's likely that more than a few errors were made, especially since overseas respondents were asked to convert their wages into US Dollars. But the data is interesting and suggestive.
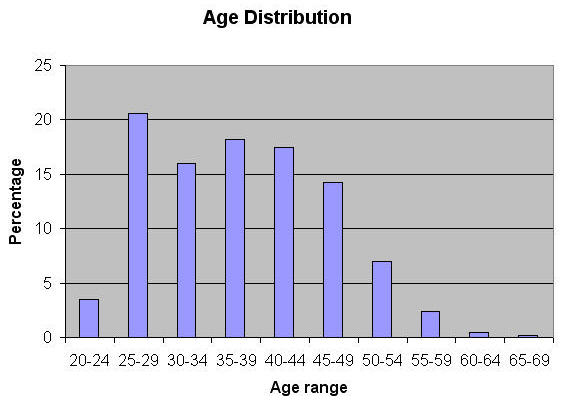
Most embedded developers are young to early middle age, with the biggest spike in the late 20s. By age 50 few remain in this field.
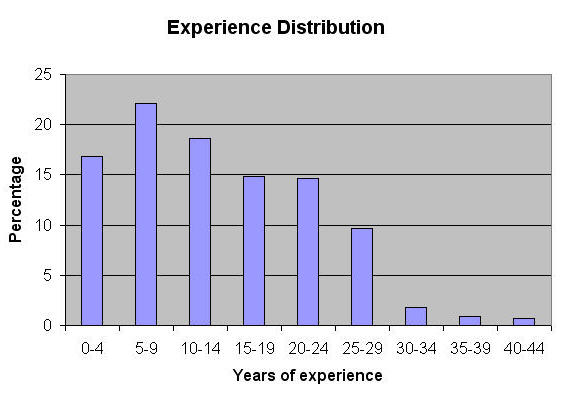
Not surprisingly, experience levels tracked ages closely, suggesting relatively few developers enter the field later in their careers. Interestingly, a few percent indicated over 35 years experience. Since the microprocessor was invented in 1971, 33 years ago, perhaps some of the older engineers cut their teeth embedding minicomputers into systems, something not uncommon in the 1960s and 70s. Those products, of course, were horrendously expensive.
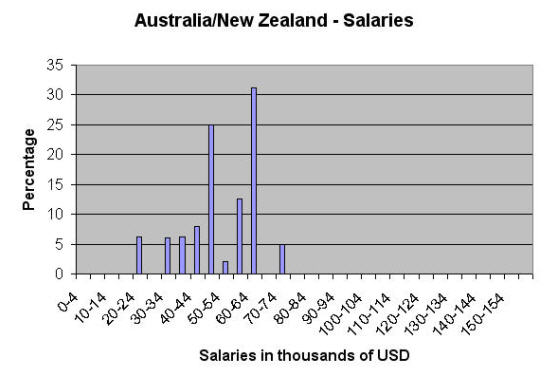
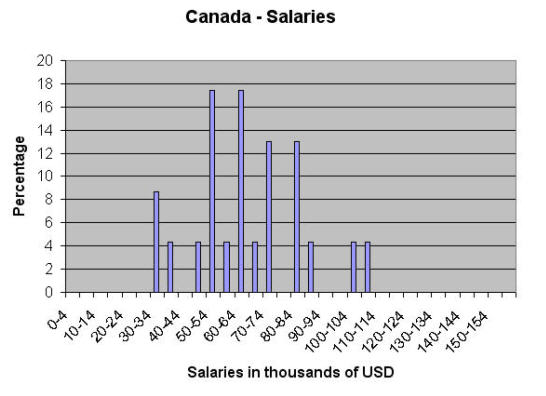
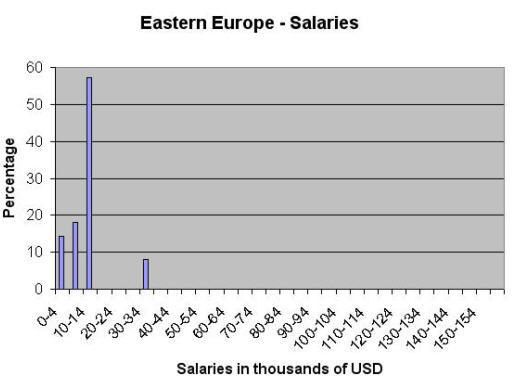
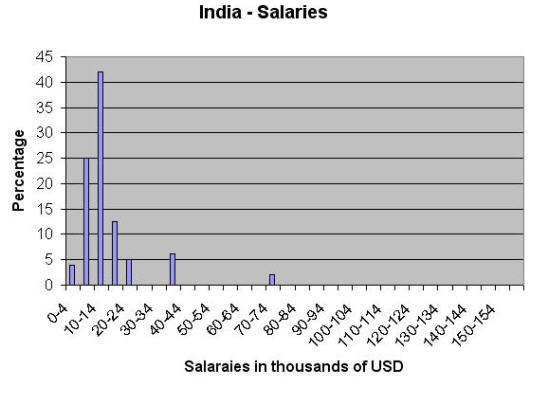
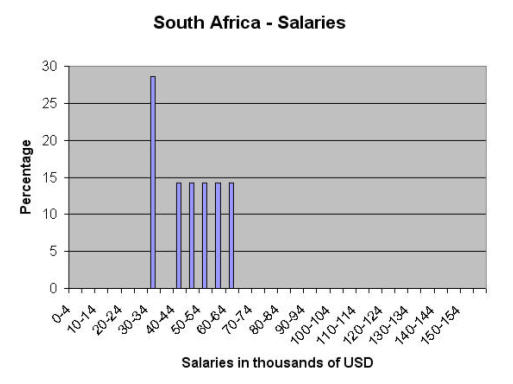
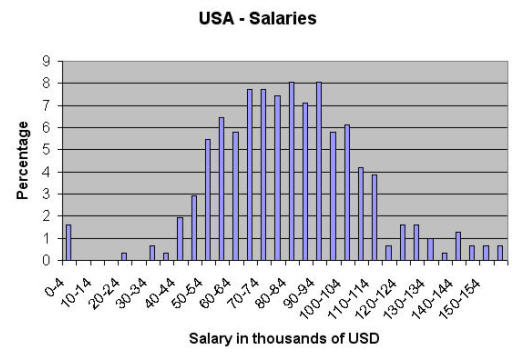
Salaries vary widely around the world, of course, with the highest ones being in the USA. The mean salary for various countries is:
| Country | Salary |
|---|---|
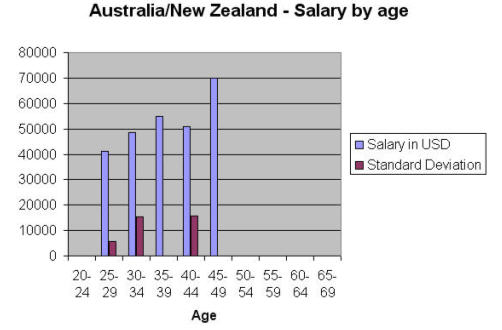
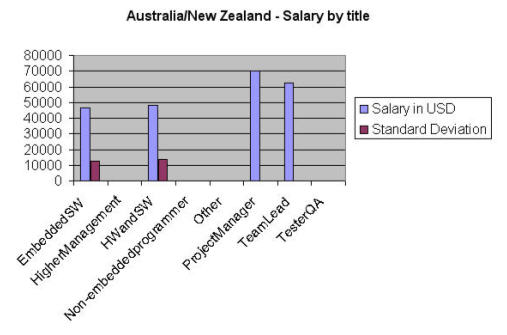
| Australia/New Zealand | 49644 |
| Brazil | 20333 |
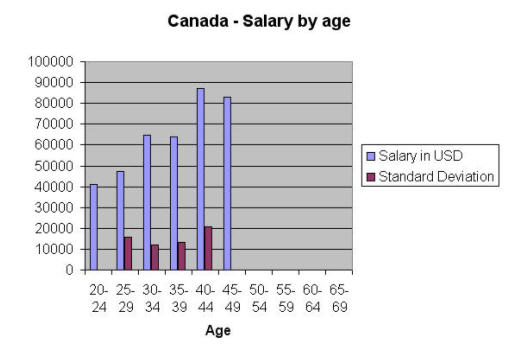
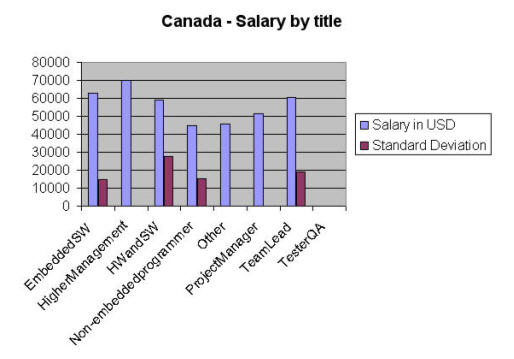
| Canada | 63337 |
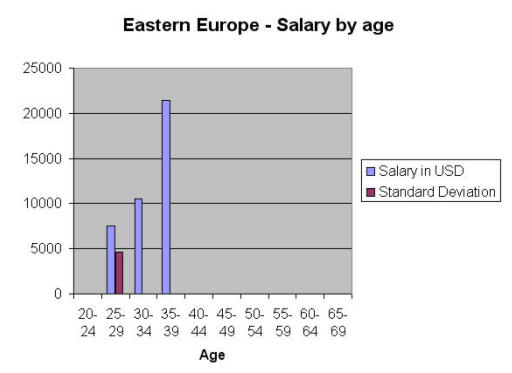
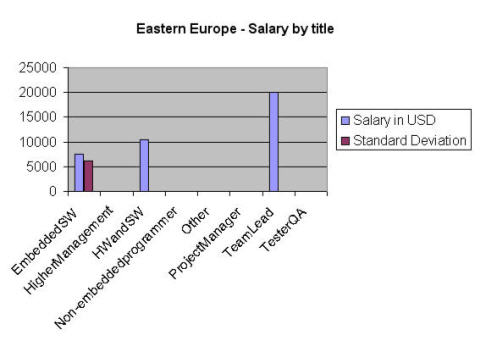
| Eastern Europe | 11914 |
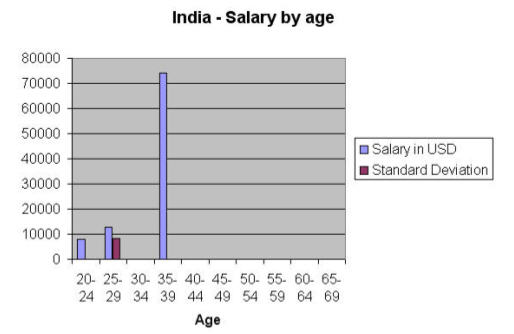
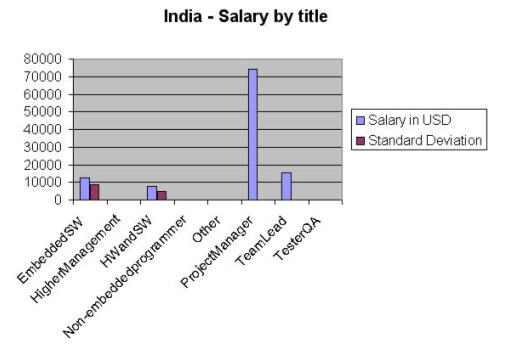
| India | 15725 |
| Mexico | 13000 |
| Pakistan | 6000 |
| Philippines | 6800 |
33540 |
|
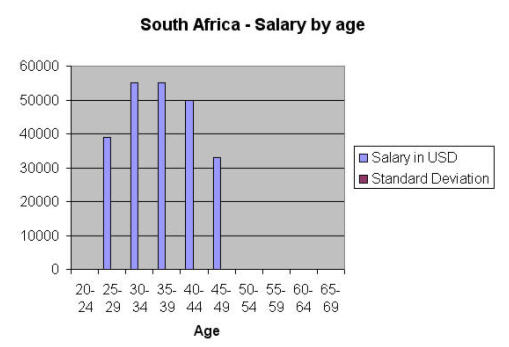
| South Africa | 44942 |
| United Arab Emirates | 7000 |
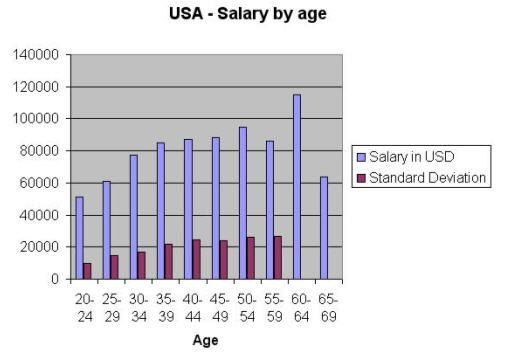
| USA | 80383 |
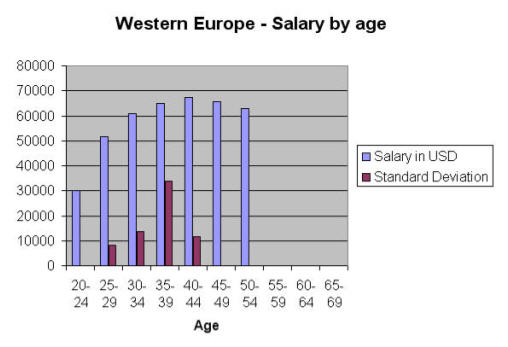
| Western Europe | 59927 |
Brazil, Mexico, Pakistan, the Philippines, Singapore and the United Arab Emirates all had under 5 respondents each, so no graphs for each of those countries were constructed.
In the USA salaries vary widely, with nearly 2% of respondents reporting themselves unemployed. One convincingly claimed to make $1m in 2004, but that data point so skewed the results it was dropped. But I want that job!
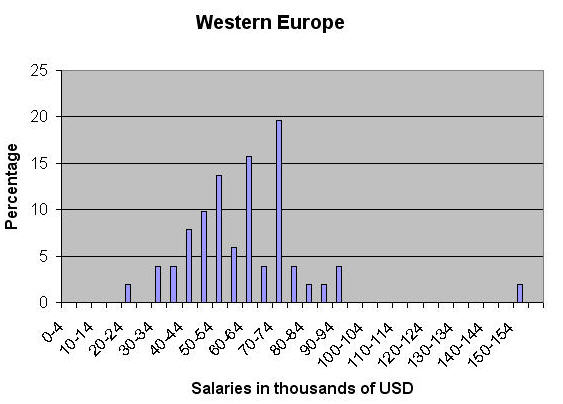
The next set of graphs shows salary distributions by age. The red lines indicate the associated standard deviation with each figure, where, as usual, one sigma indicates 65% population inclusion. Where no standard deviation is shown there were too few samples at that age to give meaningful results. It's interesting to note that the lower salary countries primarily employ younger people. But even in Western Europe there are proportionately many more younger workers than in the USA.
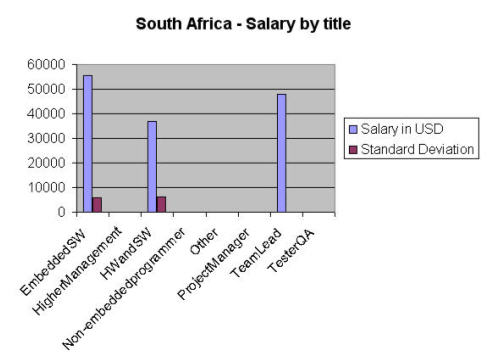
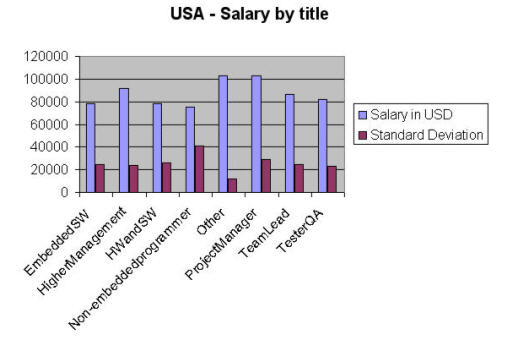
The next set of graphs shows salary distributions by title. The red lines indicate the associated standard deviation with each figure, where, as usual, one sigma indicates 65% population inclusion. Where no standard deviation is shown there were too few samples at that age to give meaningful results. There's little correlation between salary and type of embedded developer: software people and hardware/software folks score pretty close.
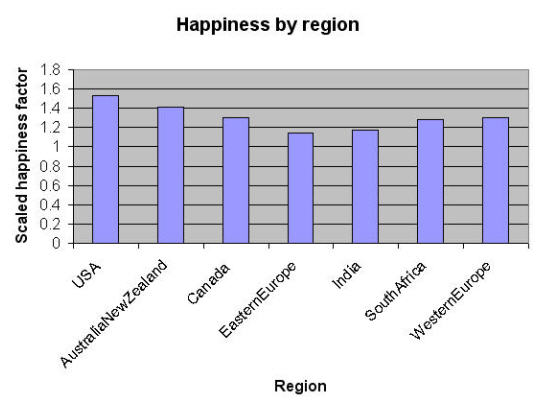
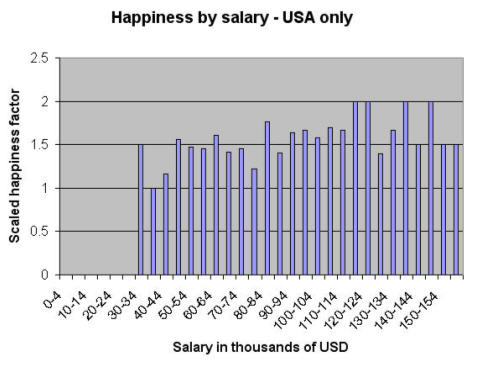
Perhaps attempting to measure happiness is a fool's quest, but as a middle-aged gent who has seen too many colleagues burn out from despair and overwork I'm convinced we must pursue happiness first and salary second. In the survey respondents rated their happiness with the job on an enumerated scale of [happy, unhappy, looking for another job, unemployed]. I dropped the unemployed as it doesn't translate to job satisfaction, and rated the other three factors from 2 (happy) to 0 (looking for another job). Those results were normalized to the number of responses in each category.
The two lowest-paying regions, Eastern Europe and India, reported the least happiness. So perhaps the old maxim that engineers want a challenge first and good money second is merely an urban legend. I have no idea. It's hard to correlate job satisfaction to salary since the cost of living varies so widely, but the next graph suggests money brings happiness. Or something.
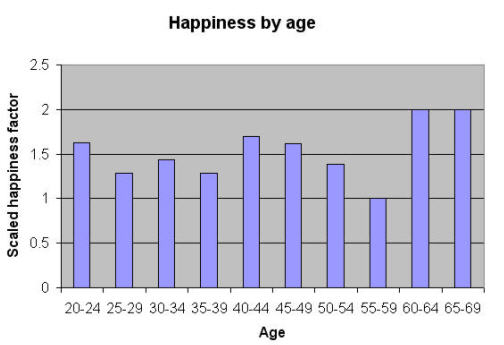
Mid-middle-aged people and older folks reported higher levels of job satisfaction than others. I wonder if that corresponds with the state of children. At 40-44 the kids are usually in a pretty easy state. Then they start driving. Note how happiness levels start to fall. The challenge of paying for multiple college tuitions in the mid-50s creates another crash. But 60ish people are free of all that and are the most delighted of all.
The following data is for the USA only to keep this document from growing too long.
US workers are by far the happiest with their jobs. That may be because those earning more than the average $80,383 rated themselves significantly happier than those making less. Or perhaps there are other sociological reasons.
Though there weren't enough respondents in Brazil to generate statistically significant salary data, all indicated they're unhappy with their jobs. No doubt few engineering labs there sport the Samba dance routines of Copacabana's night clubs.
And that's a darn shame.