

Review of the Portpilot USB Power Monitor, by Jack Ganssle
November 2014
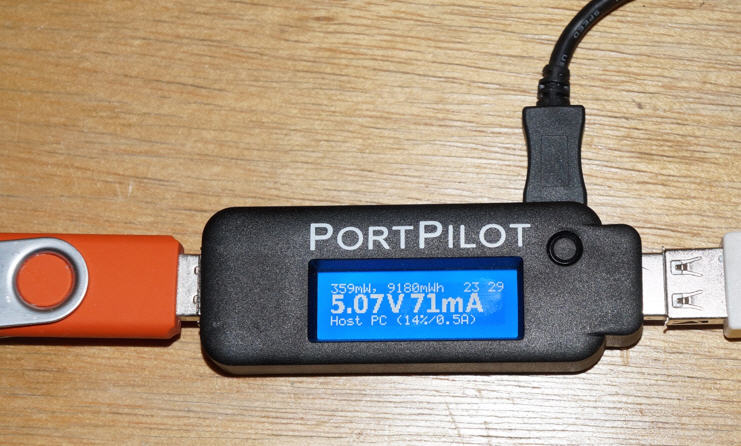
The PortPilot in action. The USB connection on the right goes to the host; on the left to the device (in this case a flash drive). The micro-USB connection on top goes to a PC for datalogging. On the display: mW being used, total mWh consumed during the session, which in this case was 23 hours and 29 minutes. The voltage and current are displayed prominently.
It allows you to elect to block data transfers between the host and the device, perhaps useful when working with a public, untrusted, USB port.
Sure, you could put a DMM in series with the USB power line. But if you're working with a USB device and need to keep an eye on current consumption this is a handy way to do so without tying up a probably-expensive meter. And, if you want to know average power consumption over some time period (which could range from seconds to years) just divide the displayed mWh by the displayed time.
The program also can enable a virtual fuse, which turns power off to the USB device if it consumes more than a settable number of mA.
The PortPilot's real strength is its logging. A micro-USB connector on the device lets you connect it to a PC. A DOS command-line program will read from the device and either show the results on the screen or log them to a file. In the following picture I instructed it to read the parameters 11 times:
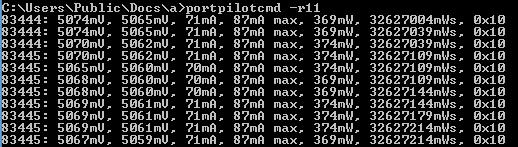
The columns are: Time (s), Vbus in (mV), VBus out (mV), Current (mA), Max current (mA), Power (mW), Energy (mWs), Status
Charting capability is included, though to use charts must install the LabVIEW runtime, which takes several minutes to install, though the process is mostly automatic. You do have to bow to Redmond's screwy architecture and restart the computer. An example display follows:
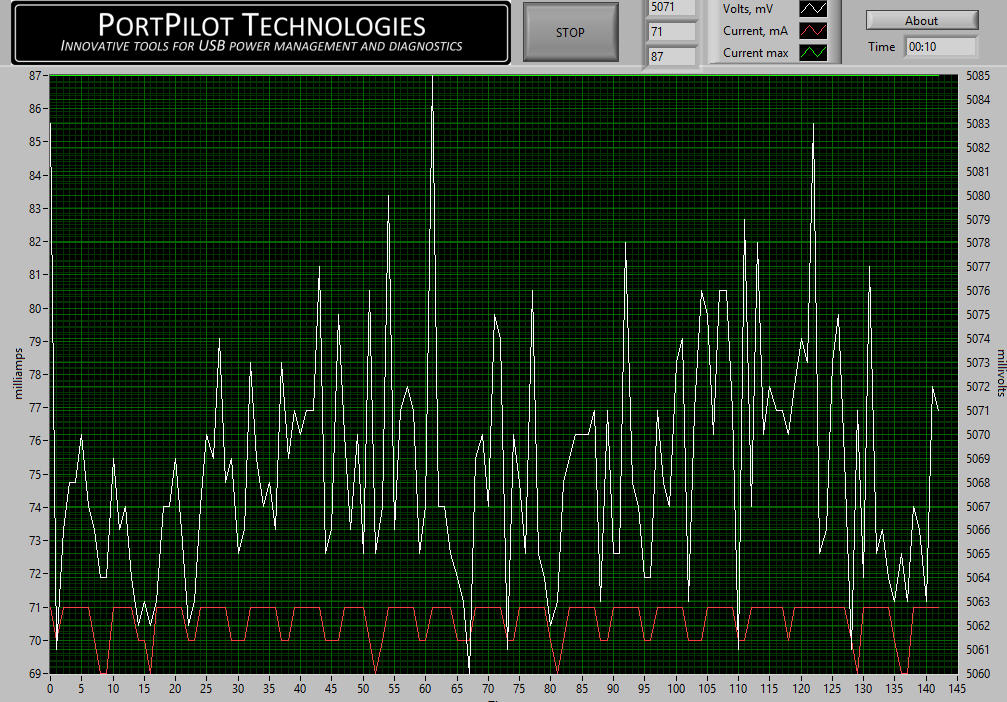
The PC software is still evolving. I asked for a capability to set how often the data gets sampled, which the company said is coming. In the graph above each new data point gets added to the right, so the horizontal axis keeps compressing. I’ve asked for a scope-like mode where only the most recent N samples are displayed.
For $60 this is a handy device if you must monitor USB power. You can find out more at www.portpilot.net.