

Real-Time Current Monitor
Summary: As power becomes increasingly important more tools are coming to market.
Consumers want their electronic gizmos to run from batteries for weeks, months and even years between recharges or primary cell replacements. Some products harvest energy from the environment. To achieve these goals processors must be positively anorexic in their electron intake. And that suggests we need equipment to profile a product's power usage.
Recently I reviewed the uCurrent, a small device designed to help monitor current consumption down to the nA range. It's aimed mostly towards those who need accurate measurements of static power. It won't help profile a system that is dynamically going from nA to mA and back since there's a range switch that has to be manipulated manually.
A brand new unit has appeared: the Real-Time Current Monitor (I'll call it the RTCM, uncomfortably close to the acronym used to suggest one should consult a manual rather than ask questions). This device is rather innovative and a bit different from any other current monitor.
Real-Time Current Monitor
Strange, huh?
The best way to grok this is to use the unit.
The following picture shows, in green, the RTCM's logarithmic output. This is with that channel inverted, as recommended, so the trace goes up as the current increases. Note that the first part of the trace (labeled "1") is the lowest current consumed. It's -5.28 volts (noted in the "Measurements" window). Taking the antilog gives a current of 5.3 uA.
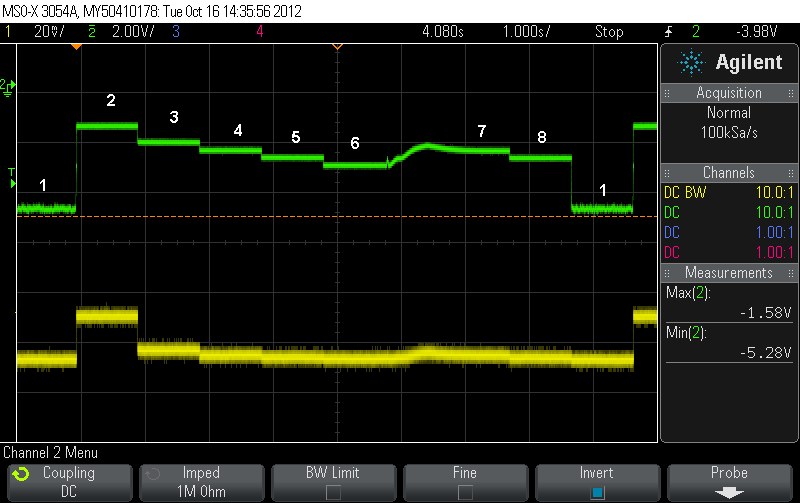
The very next division over is the highest current consumed. That's indicated by -1.58 volts, or 26.3 mA.
Later, the processor is changing clock rates and generally dancing around; the different currents are represented on the scope.
The traditional way to monitor current is to measure drop across a series resistor. I put a 1 ohm resistor in the test board's ground and measured (the yellow trace) the voltage developed across it. To see anything I had to crank the channel's gain to 20 mV/div. The highest value is clearly shown, and it's possible to see the test board's varying levels. But it's pretty much impossible to collect much quantitative data from the resistor voltages. Near the end of the screen note the huge drop on the green channel; that's visible on the yellow trace, barely. In fact the current is tumbling from 1.1 mA to 5.3 uA, nearly three orders of magnitude. The Current Monitor easily resolves values in between these levels; the voltage on the resistor cannot.
It's illustrative to show what current each step represents:
1 - 5.3 uA2 - 26.3 mA
3 - 4.5 mA
4 - 2.2 mA
5 - 1.1 mA
6 - 602 uA
7 - 2.0 mA
8 - 1.1 mA
We're looking at a real-world scenario where a processor is taking advantage of low power modes, creating a huge dynamic range of values. Logs are the natural way to deal with huge ranges.
Use the RTCM with a mixed-signal scope, and you can trigger the scope on a digital value (e.g., an instruction address or digital event) and watch the power profile, or trigger on a high-current event on the analog channel and then correlate that to what the code is doing.
The RTCM covers a range from 1 uA to 1 A. It won't measure the lowest sleep currents offered by some processors, which can be in the tens of nA, but will give a clear view of power consumption in non-sleep modes.
The bandwidth is claimed to range from 200 to 600 Hz depending on the amount of current being consumed. More current, greater bandwidth. That means it won't follow instruction-speed changes in consumption, but it will track general trends. Besides, decoupling capacitors on the board being probed may swamp out any ability to detect really fast power changes.
The unit is $150 and available from http://ee-quipment.com . For another ten bucks you buy a demo board that creates the waveform shown above. That board is the fastest way to get comfortable with this somewhat unusual notion of looking at the logarithm of scope data, and I recommend getting it.
Engineering is about predicting the performance of a design, and then measuring that performance to ensure it correlates to the analysis. It drives me crazy when developers build real-time systems but never actually measure the time consumed by interrupt handlers and the like. That's akin to design by divine intervention: if it "works" it's a miracle, and we move on. The same is true for building systems that are constrained by their energy sources: do the analysis to predict what the system will use, and then close the loop by measuring actual results.
Published October 16, 2012