

eXtreme Instrumenting for Firmware
By Jack Ganssle
Written in April 2006. I also wrote about issues with scoping and scope probes here.
The county has been repaving my street for the last few weeks. Workers brought in a big, noisy machine that ate away two inches of the old surface in a single pass, feeding a few cubic meters of ground up ruble to a succession of dump trucks each second. Then an even larger contraption pulled hot and oily asphalt from other trucks and put a pool-table-flat road down in a single pass. A small army of acolytes milled around the machine as it crept slowly along. A couple fed raw material into it, another tickled mysterious levers to control the beast, and some workers direct the procession of traffic. I walked along with them for quite a while, as it's always interesting to see how people do their job.
I watch embedded developers do their thing, too. Joe Coder is hunched in front of his monitor, furiously single-stepping, examining watchpoints, and using a debugger to ensure his code executes correctly. When the thing finally works he breathes a huge sigh of relief and moves on to the next project.
That approach makes me shudder.
Joe builds real-time code. He's doing the code part of that just fine since traditional debugging gives us great insight into the program's procedural domain. That's the if-then, do-while bit that represents the visible components of all software.
But he's totally ignoring the real-time part of his job. How long does an interrupt handler take? A microsecond . . . . or a week? Is the unit idle 90% of the time . . . or 1%?
A management maxim states "if you can't measure it, you can't manage it," which certainly holds true for developing embedded systems. We can and do measure everything about the procedural nature of the code; similarly we can and must measure and manage the nature of our systems in the time domain.
That was easy in the olden days. A dozen or more in-circuit emulator vendors offered tools that handled both code's time and procedural nature. Sophisticated trace caught every aspect of system operation at full execution speed. Time stamps logged what happened when. Performance analyzers isolated bottlenecks.
Then processors got deep pipelines, making it difficult to know what the core chip was doing. Caches followed, changing difficult to impossible. Now the processor is buried inside an FPGA or ASIC. The Age of Emulators faded as surely as the Pleistocene, replaced now by the JTAG Epoch. Ironically, as the size and scope of embedded apps exploded our tools' capabilities imploded. Most debuggers today offer little help with managing the time domain. But we must measure time to understand what the systems are doing, to find those complex real-time bugs, and to understand where the microseconds go.
| Suggestion: Subscribe to my free newsletter which often covers debugging and real-time systems. |
Output Bits
Since the tools aren't up to snuff, stride into the EEs's offices and demand, at least on the prototypes, one or more parallel outputs dedicated to debugging. It's astonishing how much insight one can glean from a system by simply instrumenting the code to drive these bits.
Want to know the execution time of any routine? Drive one of the bits high when the function starts, and low as it exits. Monitor the bit with an oscilloscope - which every lab has - and you can measure time to any precision you'd like. The cost: pretty much zero. Insight: a lot.
The top trace in figure 1 monitors an interrupt request line. On the bottom we see the output bit, driven high by the code when the corresponding interrupt service routine starts, and low immediately before exit. The time from the leading edge of the request to the assertion of the bit is the interrupt latency, a critical parameter that let's us know that the system will respond to interrupts in a timely manner. Then, duration of that bit's assertion tells us the ISR's execution time.
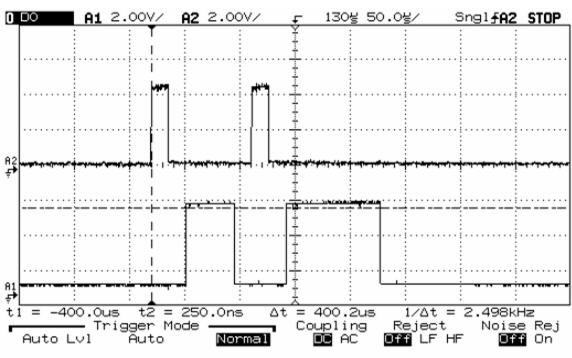
Figure 1: Top: Interrupt request. Bottom: ISR execution time
Note that the same ISR has been invoked twice, with different responses each time. No doubt there's a decision in the code that changes the execution path. Or a pipeline might be filling, or any of a dozen other factors effect the routine's performance. Trigger a digital scope on the bottom trace's rising edge, as shown in figure 2. The time from the bit being asserted to the beginning of the hash is the fastest the thing ever runs; to the end of the hash is the slowest.
Wow - two lines of code and one output bit gives a ton of quantitative information!
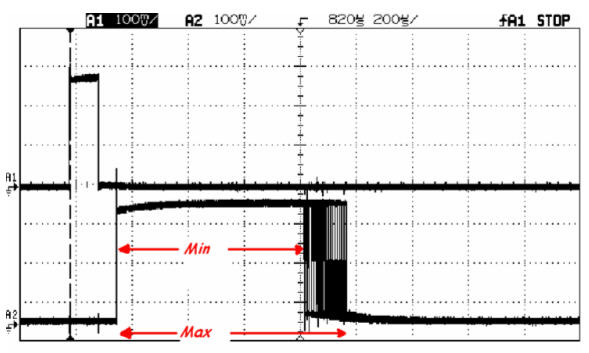
Figure 2: Measuring min and max times
Wise managers demand parametric data about firmware performance at the end of a project. How much free flash space do we have? How about RAM? Without that data it's impossible to know if it's possible to enhance features in the future. The same goes for performance numbers. If the system is 99.9% loaded, adding even the simplest functionality will have you emulating Sisyphus's for a very long time.
Instrument the idle loop or create a low priority task that just toggles the output bit, as shown in figure 3. Where there's hash, it's idle. Where there's not, the system is busy.
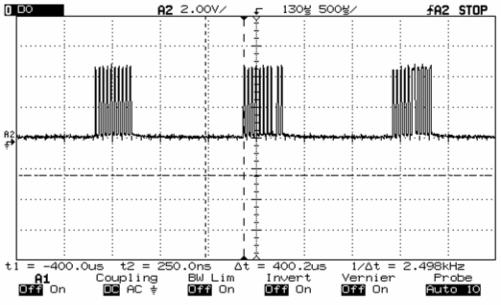
Figure 3: Measuring idle time
This is easy to do since many operating systems have a built-in hook that's called whenever the system has nothing to do. Micrium's uC/OS-II, for instance, invokes the following routine, to which I added instructions to toggle the output bit:
/*************************************************
*                                  IDLE TASK HOOK
**************************************************/
void  OSTaskIdleHook (void)
{
             outportb(test_port, 1);	// Assert instrumentation pin


}
The cost: 480 nsec on a 33 MHz 186.
eXtreme Instrumentation
What we really want is a performance analyzer, an instrument that's always connected to the system to constantly monitor idle time. The tool then immediately alerts you if new or changed code suddenly sucks cycles like a Hummer goes through gas. But plan on spending a few tens of thousands for the tool.
Or not. Remove all load from your system so the idle hook runs nearly all of the time. Use the scope to figure the duty cycle of our trusty output bit. On my 33 MHz 186 system running uC/OS-II the duty cycle is 8.6%.
Now get Radio Shack's 22-218A voltmeter (about $15) and remove the back cover. Find the 29.2 K resistor and change it to one whose value is:
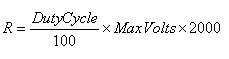
Where DutyCycle is in percent and MaxVolts is the system's power supply voltage.
Monitor the output bit with the meter as shown in figure 4. Congratulations! Your cheap VOM is now a $10k performance analyzer. It'll show the percentage of time the system is idle. Leave it hooked up all the time to see the effect of new code and different stimuli to the system. The Radio Shack salesman tried to sell me an extended service plan, but I'm pretty sure this mod will void the warranty.
It's fun to watch colleague's jaws drop when you explain what you're doing.
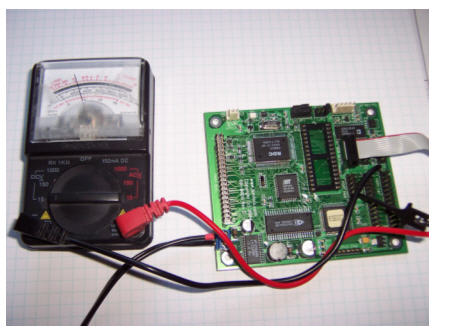
Figure 4: A poor person's performance analyzer
The needle's response won't keep up with millisecond-level changes in system loading. Not a problem; modify the idle hook to increment a variable called Idle_Counts and invoke the following task every second:
static void Compute_Percent_Idle_Time (void *p_arg)
{
float Num_Idles_Sec=178571.0;	// In fully idle system we
                              //    get this many
                              //    counts/sec
float Idle;		     		// Percent idle time
while(1){
    Idle= 100.0 * (((float) Idle_Counts)/Num_Idles_Sec);
    printf("\nIdle time in percent= %f", Idle);
    Idle_Counts=0;
    OSTimeDly(OS_TICKS_PER_SEC); // Go to sleep
    }
}
Obviously the Num_Idles_Sec parameter is system-dependent. Run the code in a totally idle system and look at Idle_Counts to see how many counts you get in your configuration.
Modify the routine to suit your requirements. Add a line or two to compute min and max limits. I naughtily used printf to display the results, which on my 186 test system burns 40 msec. This is a Heisenberg effect: making the measurement changes the system's behavior. Better, log the results to a variable or send them to whatever output device you have. Consider using longs instead of floats. But you get the idea.
R-2R
Some lucky readers work with a hardware designer who has a fond spot for the firmware crowd. Buy him a beer. Wash her car. Then ask for more than a single output bit - maybe even three.
Construct the following circuit and connect the three points with PIO designations to the output bits. Often called an R-2R latter network, this is an inexpensive and not-terribly-accurate digital to analog converter.
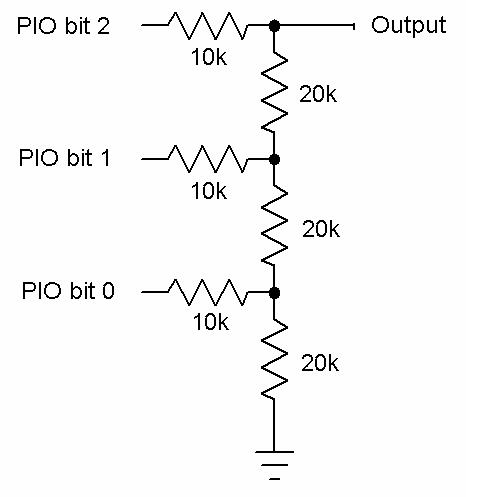
Figure 5: A $0.05 D/A converter
Now we can look at the real-time behavior of tasks. in real time. Want to know which task executes when? Again using uC/OS-II, change the Micrium-supplied hook that executes whenever a task is invoked as follows:
/********************************
*                   TASK SWITCH HOOK
********************************/
void  OSTaskSwHook (void)
{
   outportb(test_port,
             OSTCBCur->OSTCBId);
}
This sends the next task's ID (a number from 0 to whatever) to those output bits. Probe the R-2R ladder with the scope and you'll see something that looks like figure 6.
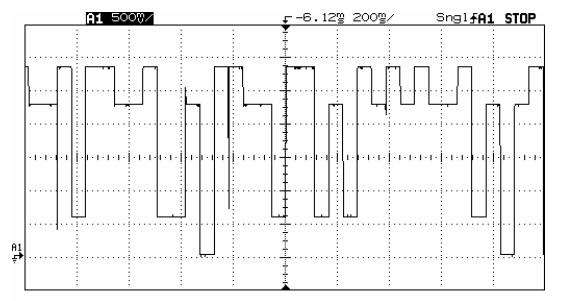
Figure 6: Executing tasks, in real time
Task 0 is running when the scope reads zero volts. Task 1 when the voltage is 1/8th of the power supply, etc. By adding less than a microsecond of overhead we can watch how our system runs dynamically. Sometimes it's useful to trigger the scope on some event - say, a button press or the start of incoming data. The scope will show how the system schedules tasks to deal with that event.
Three bits lets us monitor 8 tasks. More bits, more tasks. But the resistor network isn't very accurate, so after about 4 bits use a real D/A converter instead.
The same technique can monitor the system's mode, if you maintain mode or status info in a few bits. Or the size of a stack or the depth of a queue. Compute the data structure's size, correct for wrap on circular queues, and output the 3 or so MSBs. In real-time, with little Heisenberging, you'll see system behavior - dramatically. It's simple, quick, inexpensive. . . and way cool.